How Visual Diffs Work
When a Preview is built from a Base Preview, Tugboat can generate Visual Diff images to highlight any changes between the Base Preview and the new Preview.
How are Visual Diffs calculated?
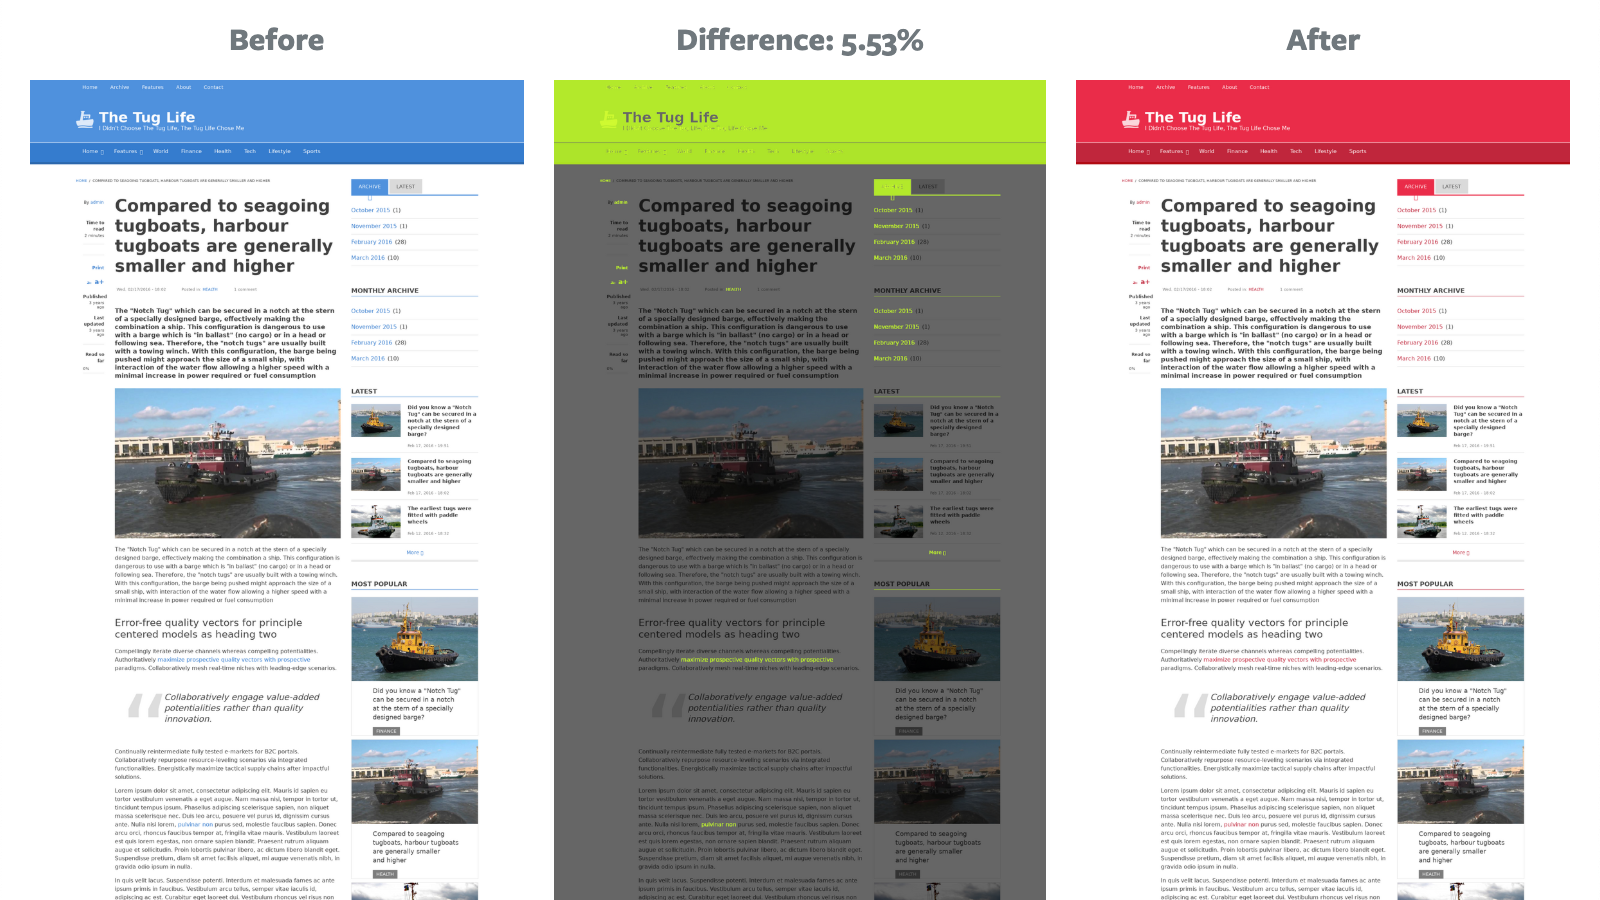
Tugboat’s Visual Diffs implementation is a pixel-by-pixel comparison of what a Preview page looks like. The percent calculation displayed next to the diff is a literal calculation of how many pixels have changed in the page from Before to After. This makes it a great tool for front-end developers to visually see what has changed on the page, and it also helps Q/A, Product and UX spot new feature implementation - and also regression bugs.
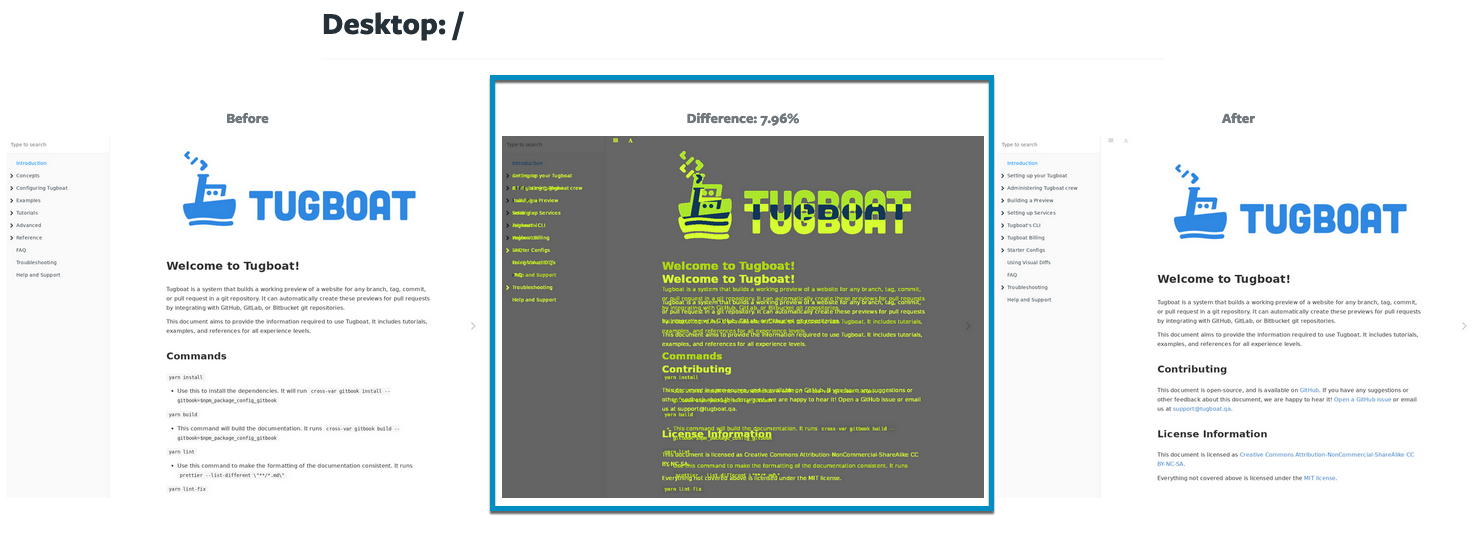
As a result of the way Visual Diffs are calculated, though, when you move something at the top of the page that bumps content down, the whole page may show up as changed. This is because all of the pixels on the pixel-by-pixel calculation are no longer an exact match; everything has shifted down. It’s great for visual regression testing, or spotting the introduction of new bugs, but may make something like diffing content changes visually less meaningful.