View Lighthouse Reports
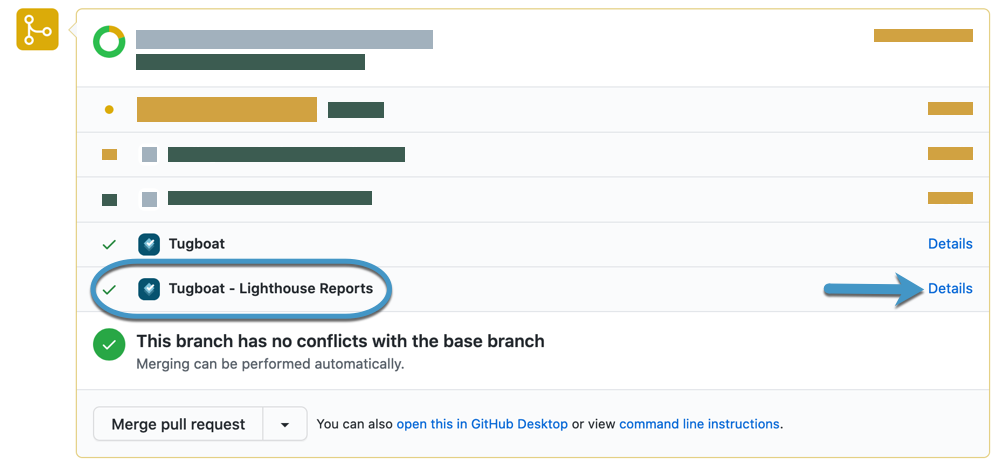
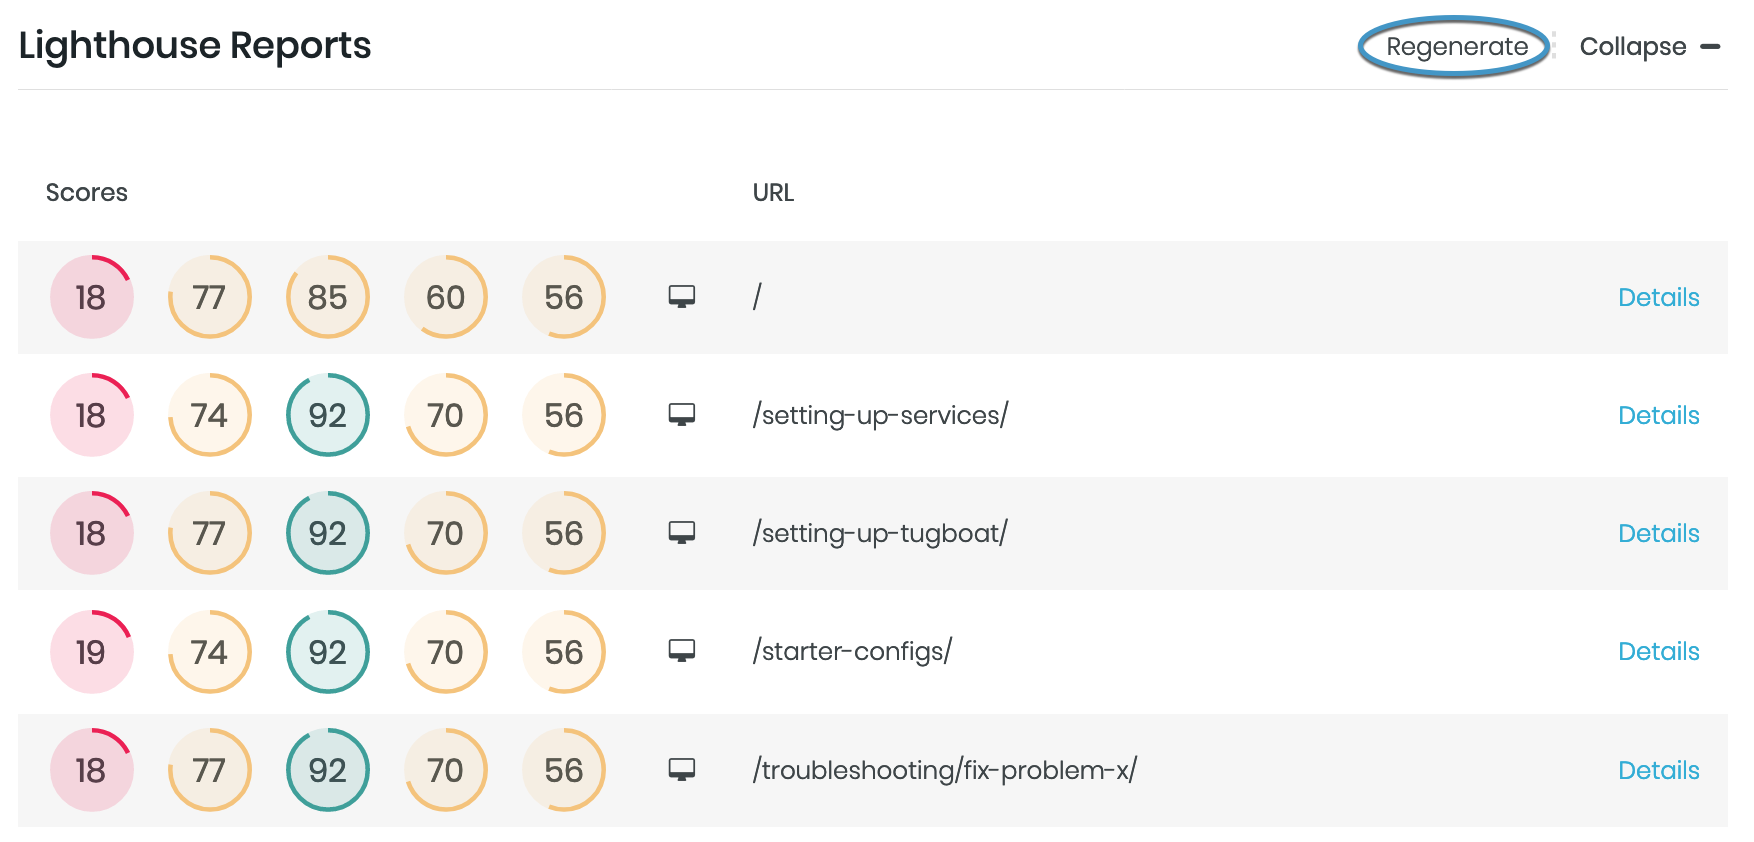
When you configure Tugboat to generate Google Lighthouse reports for your web app or website, you’ll see a Lighthouse Reports status on your pull requests. You can click the Details link to go directly to the Lighthouse reports in the Tugboat Preview Dashboard.
Alternately, to view Lighthouse reports from within Tugboat, here’s how to get to the Preview Dashboard:
To view Lighthouse reports:
- Click into a Preview that has finished building.
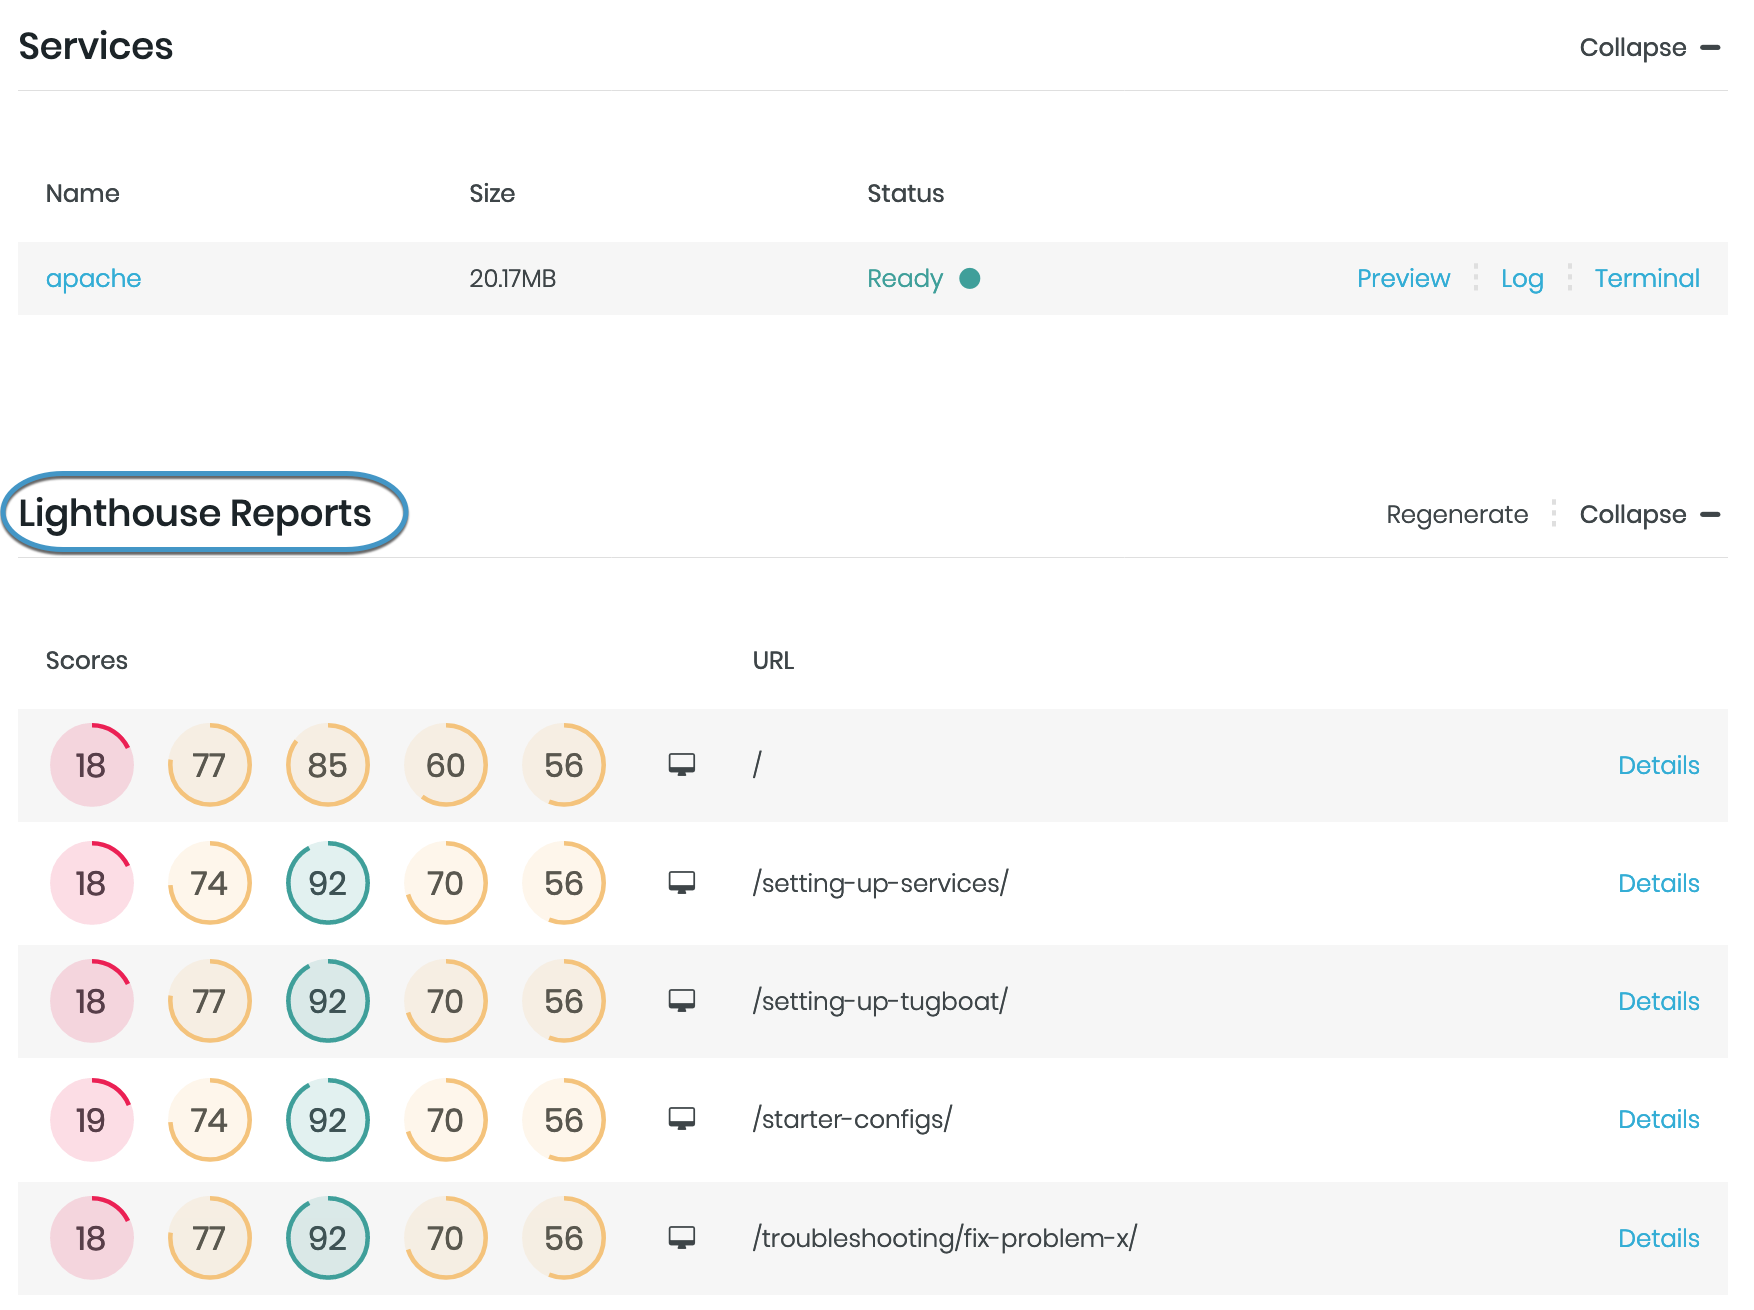
- Scroll down past the Services and you’ll see the Lighthouse Reports pane.
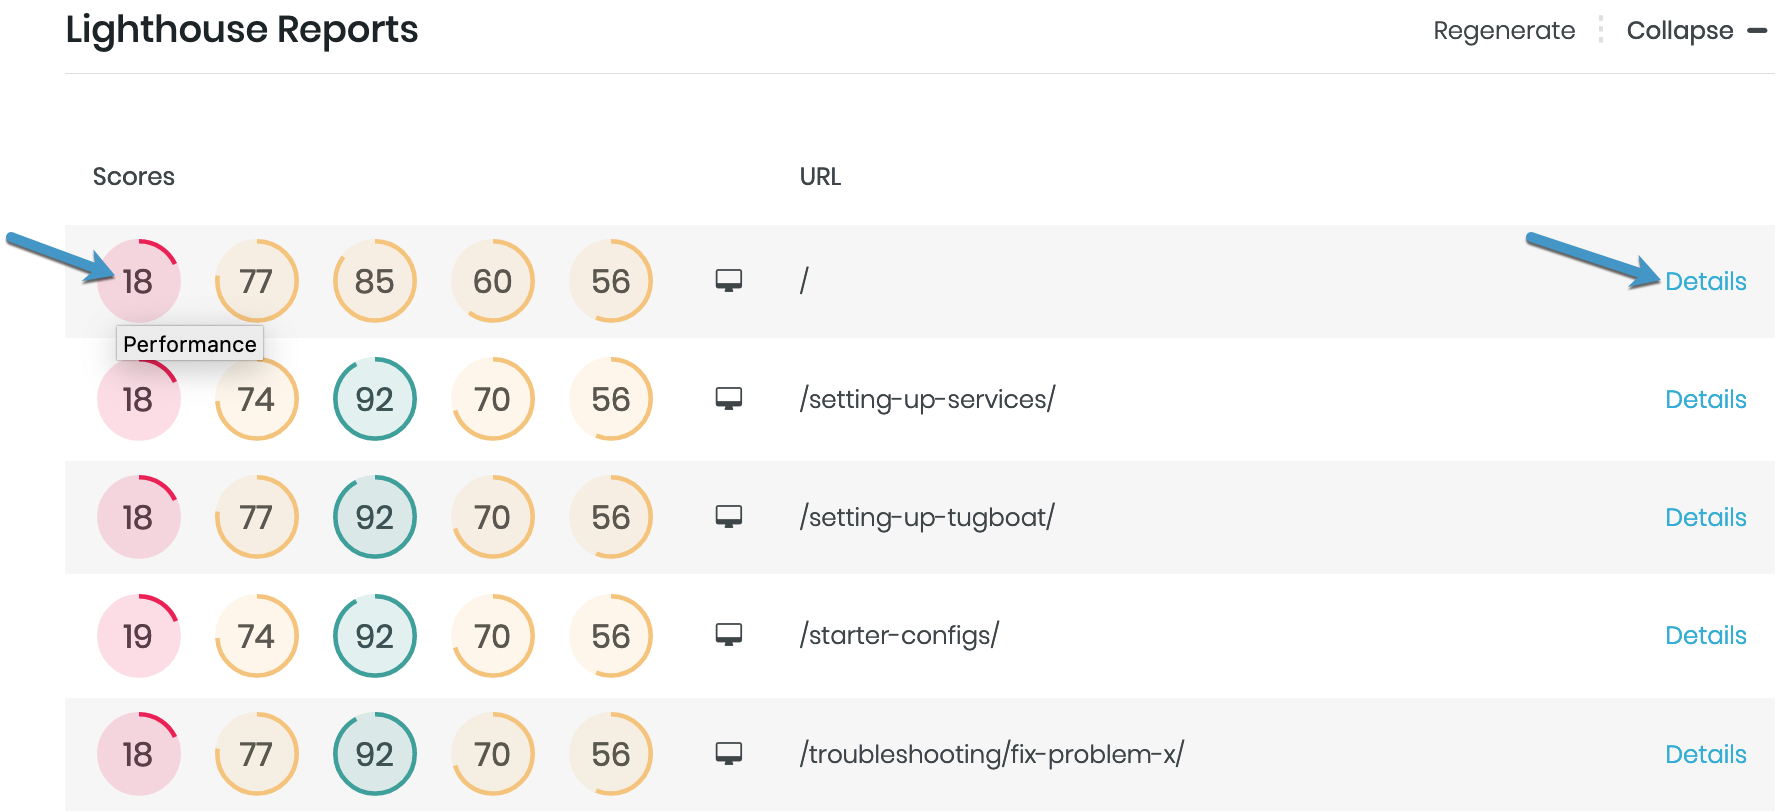
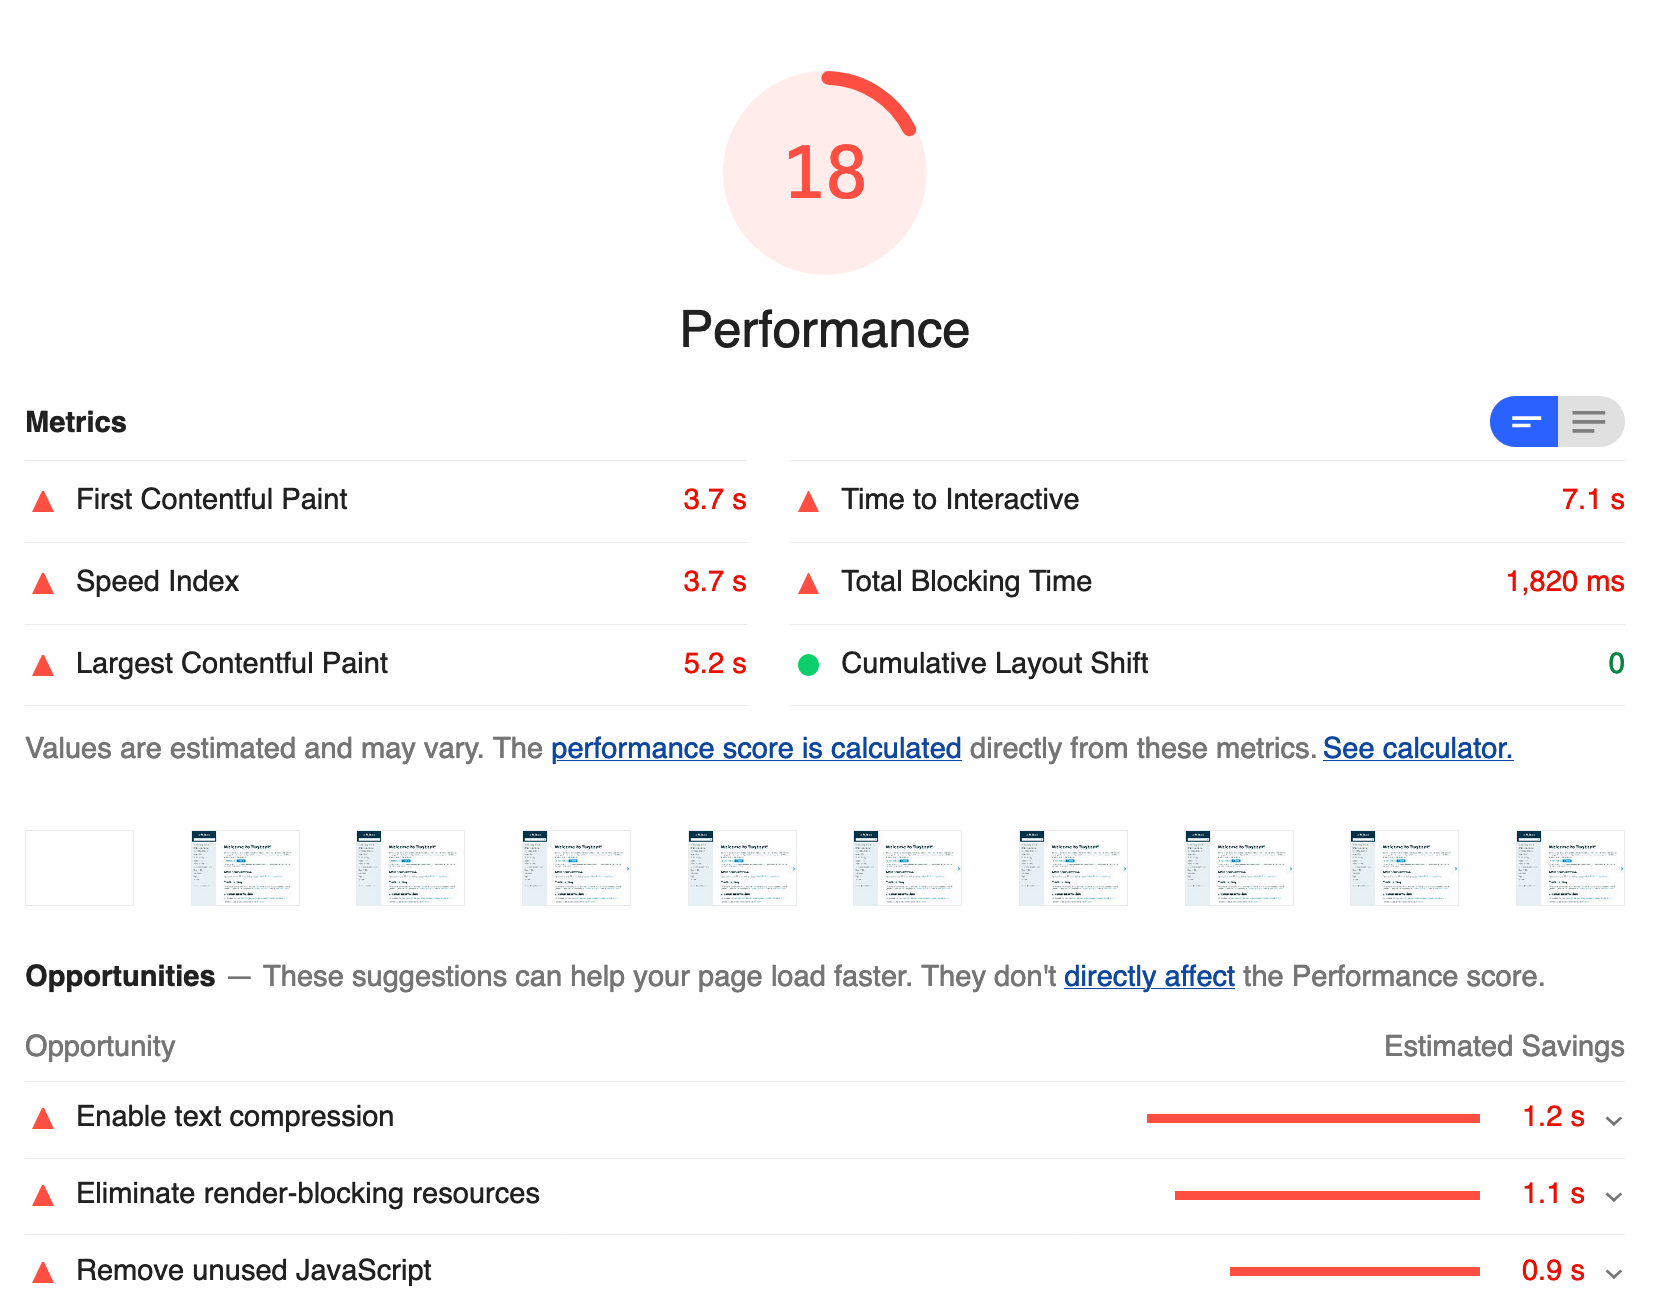
- Click into one of the numbers to view the specifics for that category’s audit, or click the Details link to view the full Lighthouse report.
Inside the Lighthouse report, you’ll see a list of audit items that were checked to provide your score. For more information on what you’ll see in Lighthouse reports, take a look at: Using Lighthouse -> What do Lighthouse reports measure?
You’ll also see an option to Regenerate Lighthouse reports.
Info
While the Preview is building, you’ll see: “Unavailable while preview is building” in the Lighthouse Reports pane. After the Preview build has completed, the Lighthouse reports will generate.
