Inside a Preview
When you click into a Preview, you’ll find a few different things:
- Services and their logs
- Lighthouse reports
- Visual Diffs
- Captured mail
- Preview log
- Preview Statistics
Services
One of the first things you’ll see inside a Preview is a list of all Services running in that Preview, as well as information about each of these services. From here, you can:
- Determine which Service is the Default Service
- Click into Service names to view build logs and output logs for your Services
- Using the Preview Action inside a Service
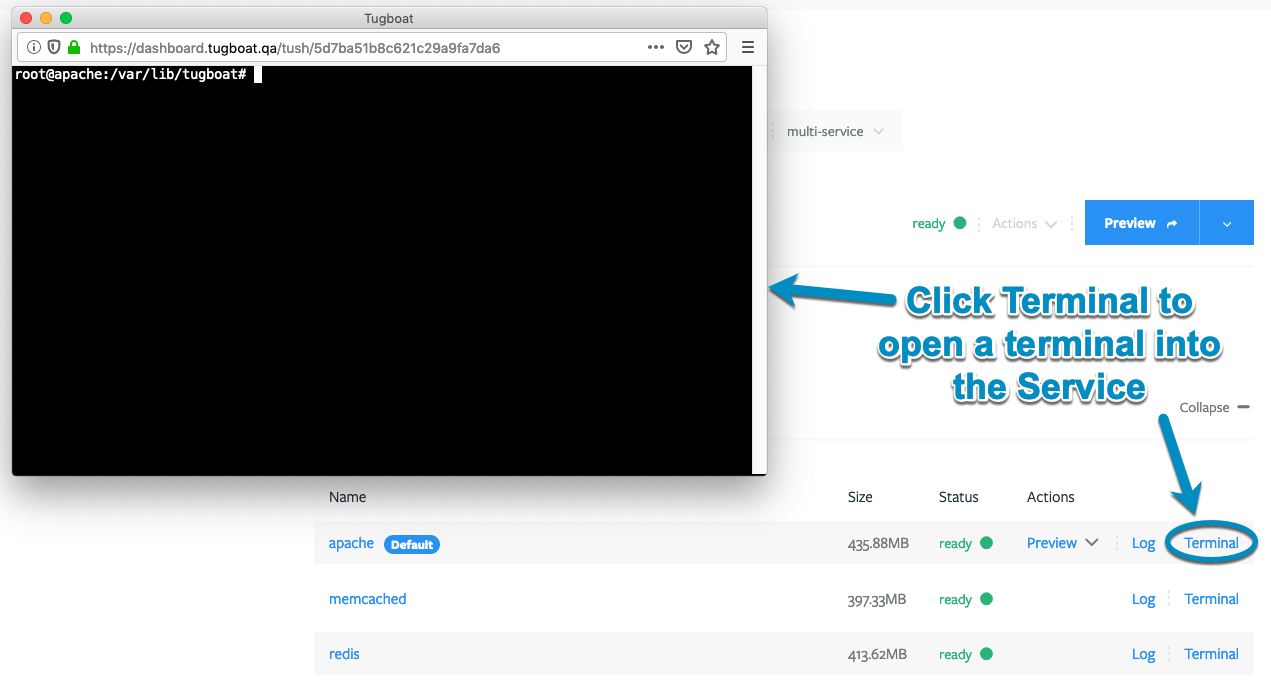
- Start a Terminal in the Service for an on-demand development environment, or to troubleshoot Preview Build failures
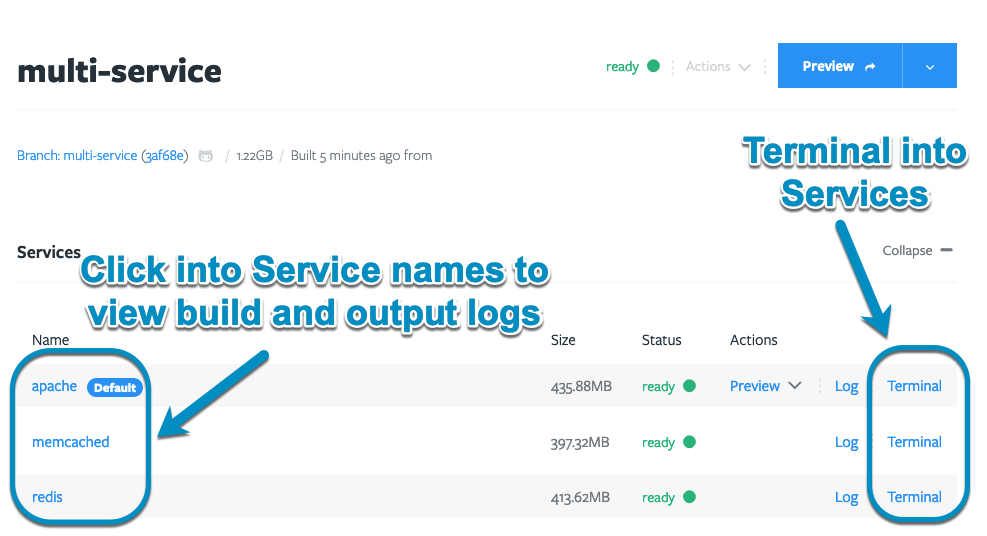
Click into Services to view build and output logs
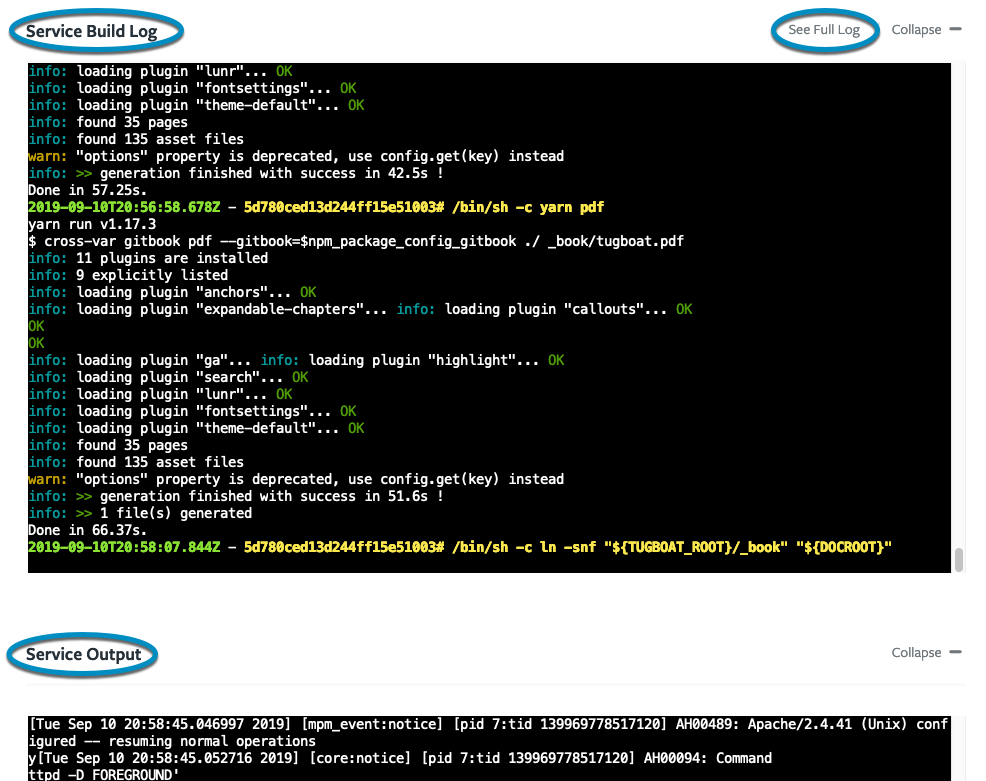
When you click into the Service name, you’re drilling into that Service’s details. You’ll see the Service Build Log and Service Output, giving you greater insight into what’s happening within your Services. This can be useful when you’re troubleshooting an issue with a Preview Build.
Using the Preview Action inside a Service
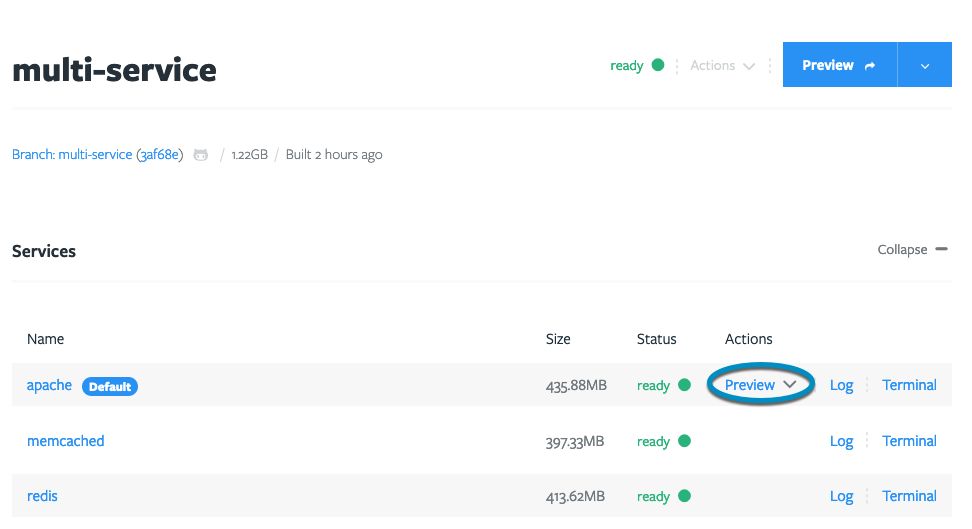
When a Service has an exposed port, you’ll see a clickable Preview link for that Service. Clicking the Preview link takes you into what that Service is doing.
The default service always has an exposed
port, so you’ll always have the option to Preview that Service. If that is the only Service that has an exposed port -
i.e. it’s the only Service with the Preview link - what you’ll see is the same as
clicking the blue Preview button.
If you manually expose a port in a Service
that isn’t the default, you’ll see the Preview option for that Service, too. Clicking into a
Preview link for a Service that isn’t the default shows you only what that Service is
doing.
Start a terminal in the Service
Starting a terminal inside a Service gives you two awesome abilities:
- Utilize an on-demand development environment to collaborate with peers
- Directly troubleshoot Preview Builds from within their Services
Tugboat as an on-demand development environment
Imagine one of your colleagues is working on a new feature, and comes to you for help because you know more about using
npm. You don’t have the code installed locally, and it can be a hassle to replicate a colleague’s local. Instead, you
can spin up a Tugboat Preview Build that uses your colleague’s code, and terminal directly into apache to team up with
your colleague - developing right in the container. Speed up development, and take local configuration questions out of
the equation.
Direct Preview Build troubleshooting from within a Service
Isn’t it frustrating when a CI build fails, but you don’t have a good way to find out what went wrong? If you’re comfortable debugging on the command line, you can open a terminal directly into your Services to troubleshoot and test fixes for Tugboat Build failures.
Lighthouse Reports
When you’re using Lighthouse to audit your Previews, you’ll click into the Preview to view the Lighthouse audit reports. Lighthouse audits are a great way to check for common accessibility, performance, SEO, and best practices issues.
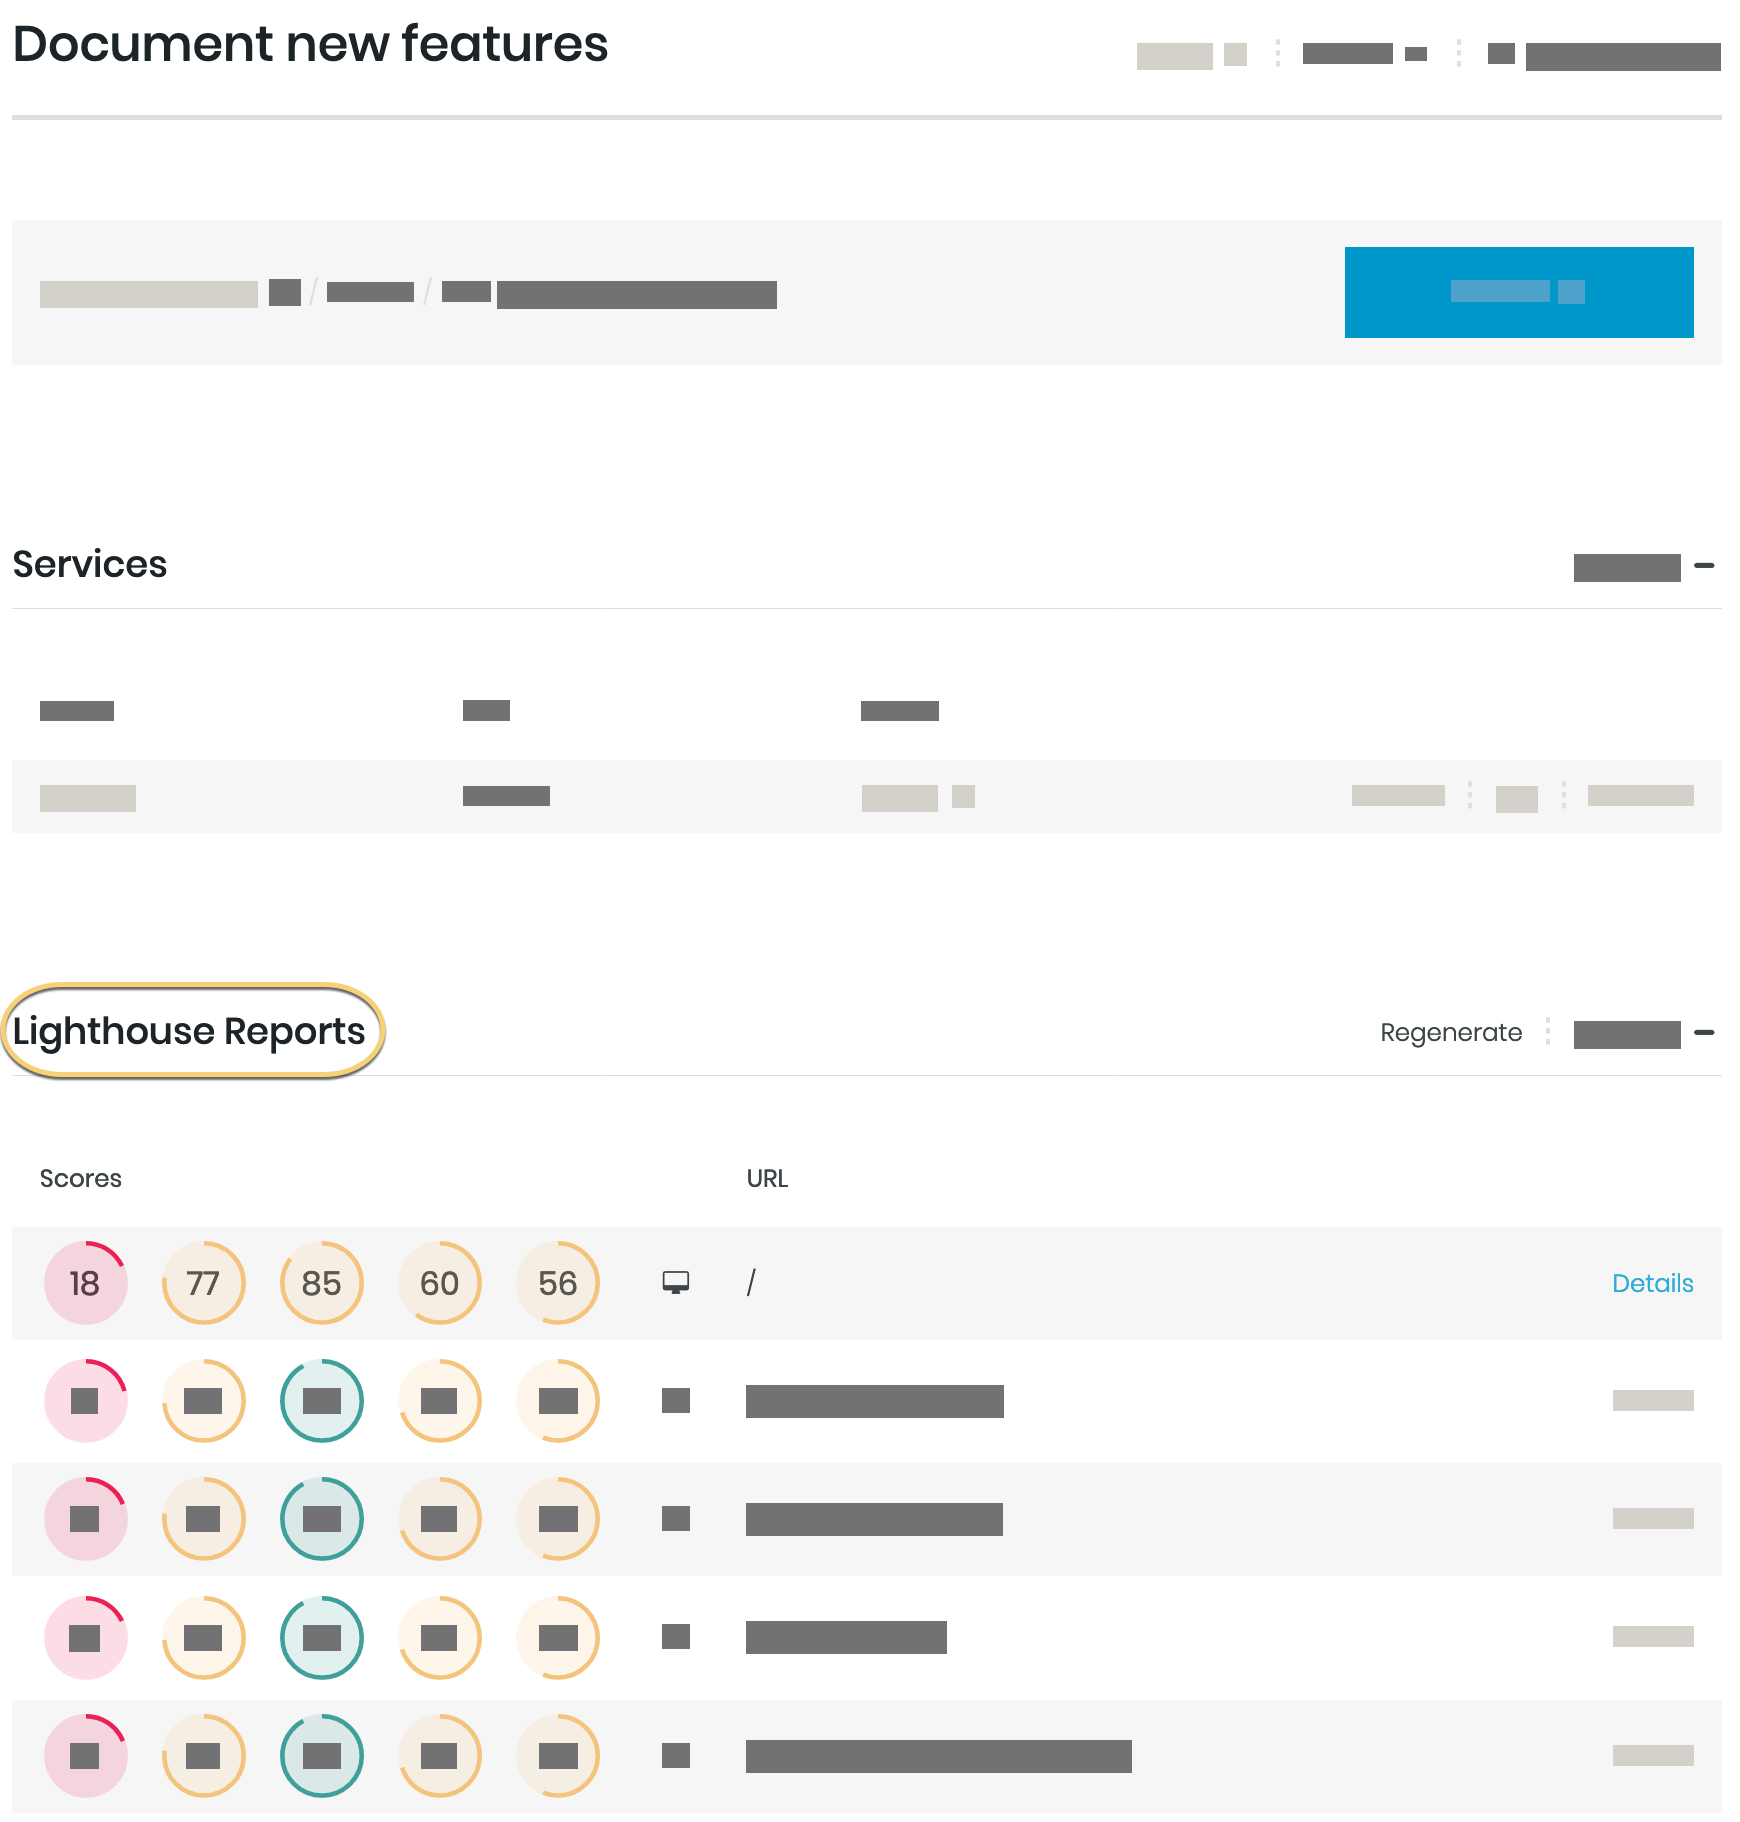
For more on Lighthouse reports, including how to set them up and use them, see: Using Lighthouse.
Visual Diffs
When you’re using Visual Diffs with your Previews, you’ll click into the Preview to view them. Visual Diffs are a great tool to visualize site changes, and it’s an easy way to spot visual regression.
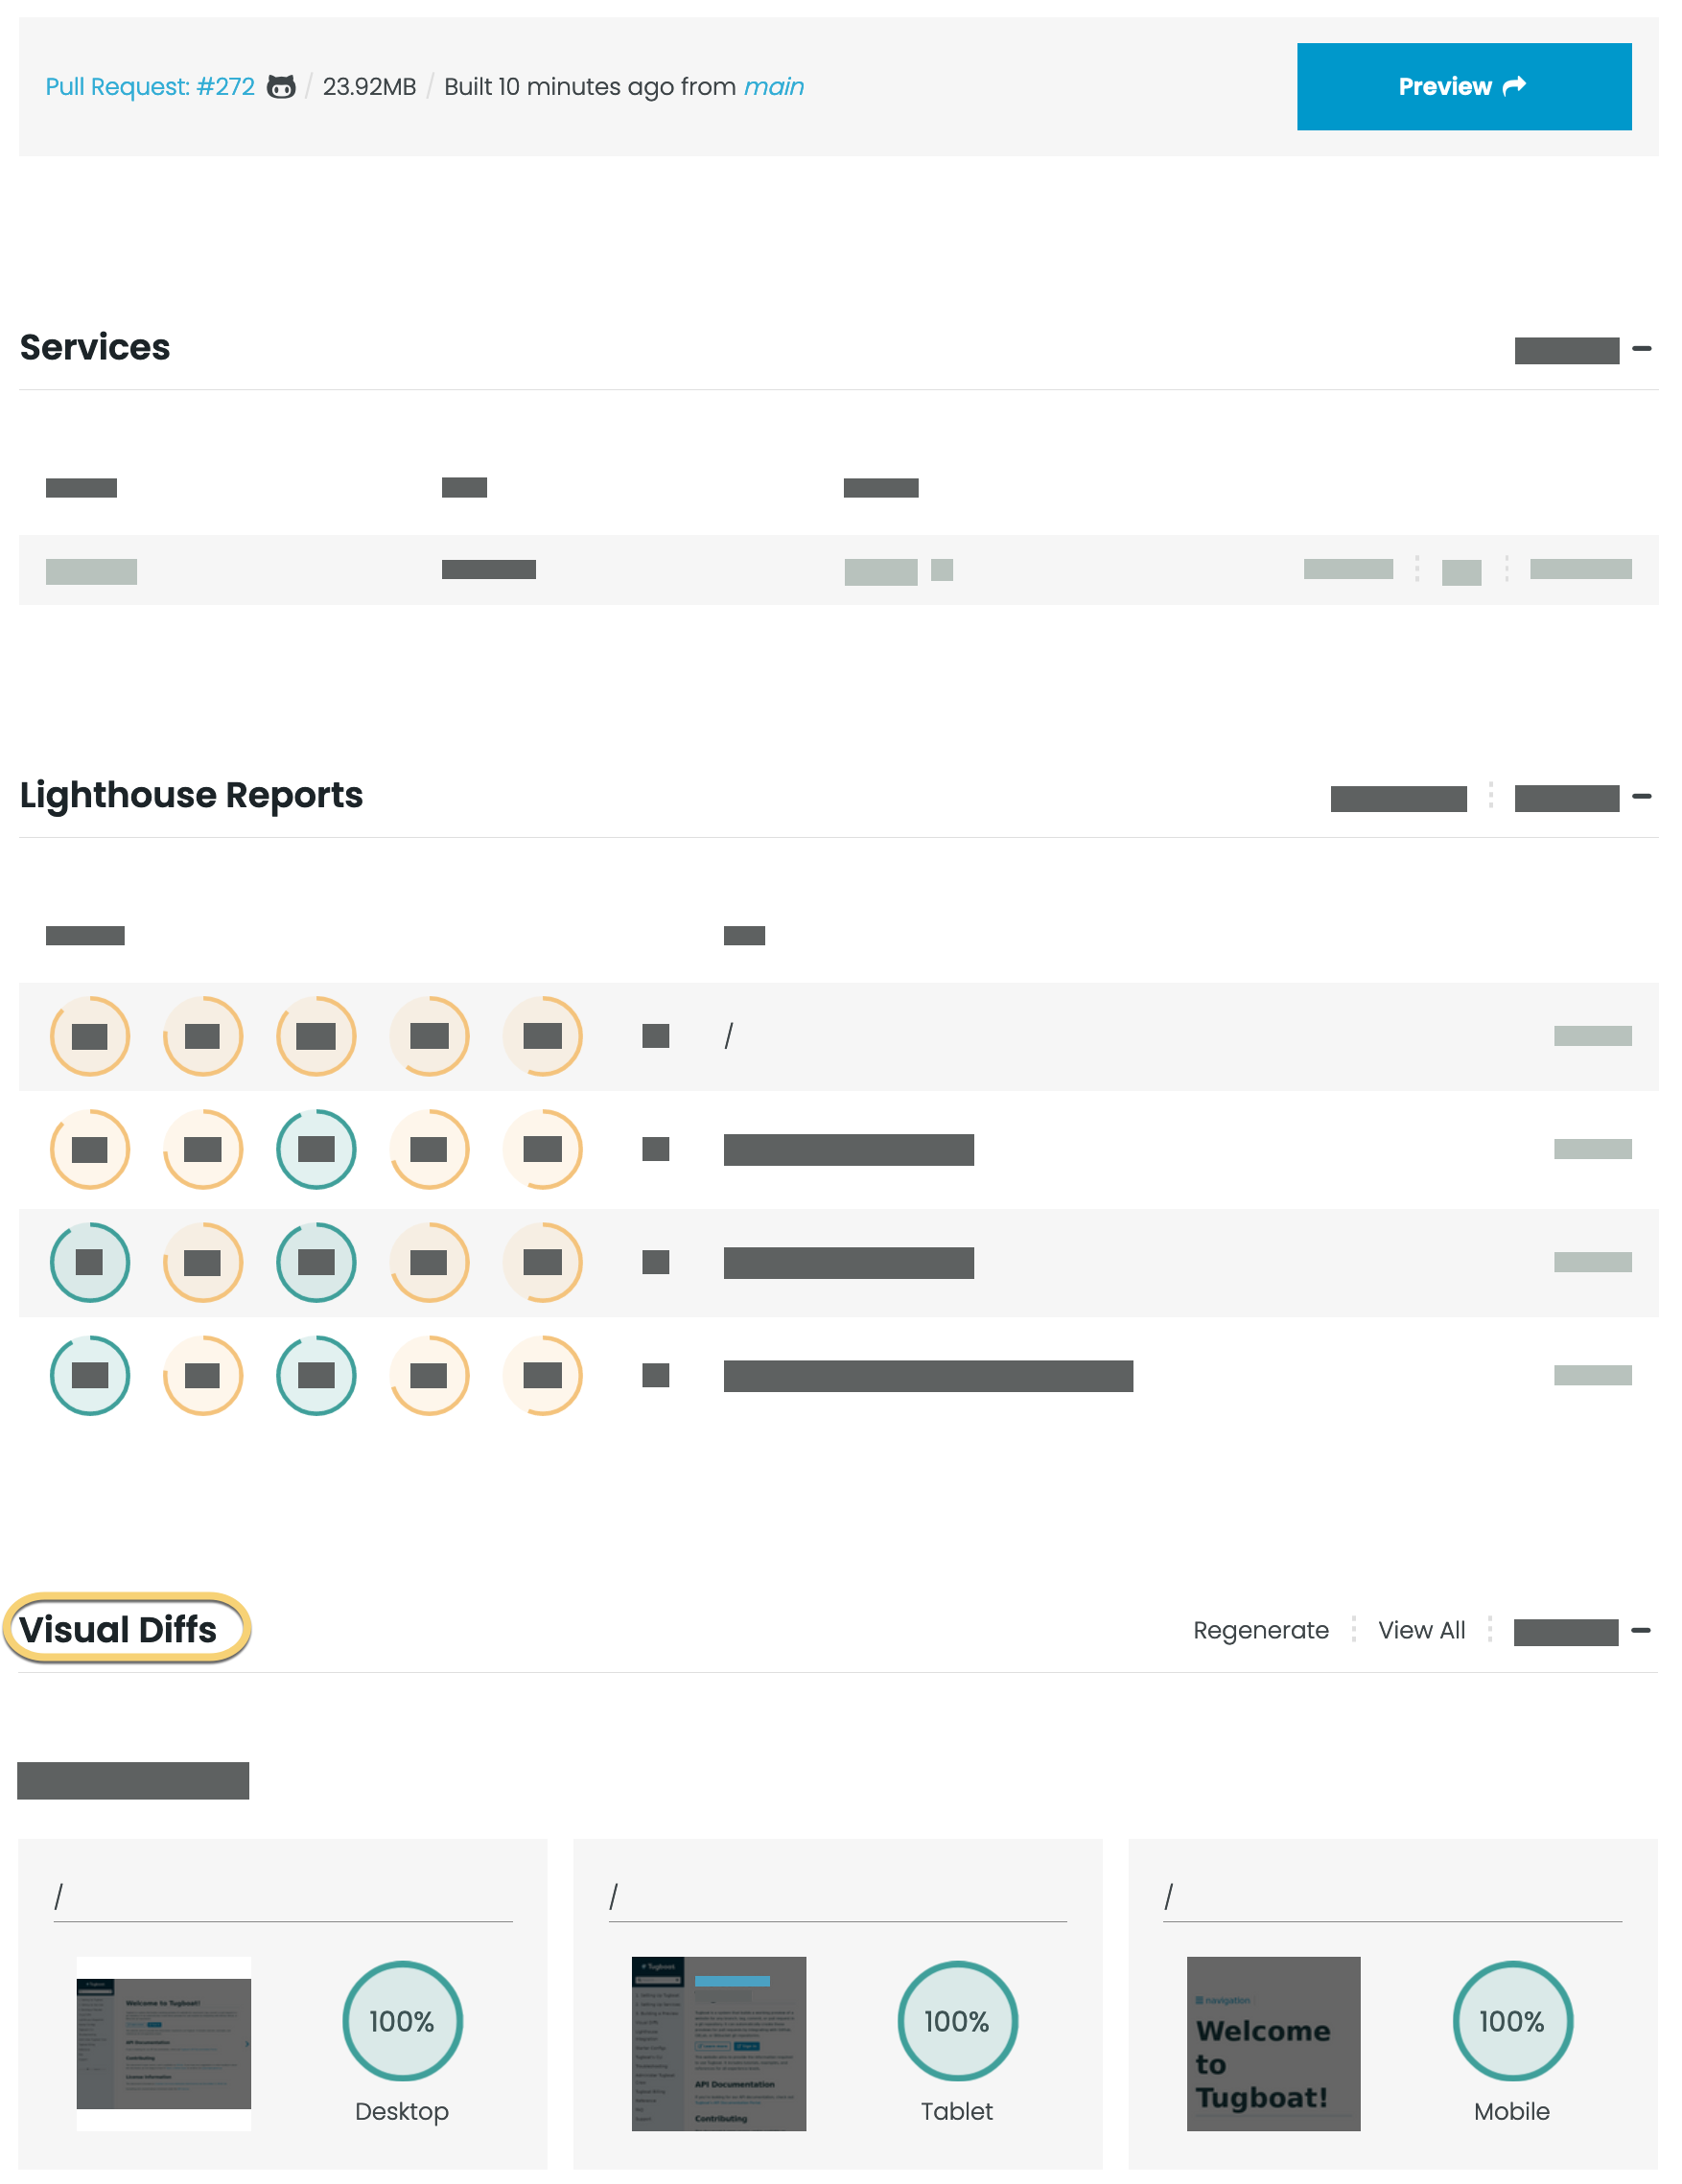
For more on Visual Diffs, including how to set them up and use them, see: Visual Diffs.
Preview log
In the Preview log section, you’ll see a build log for your Preview build. The Preview Log pane may not show the entirety of the log; if you’ve got a complex build, you may need to click See Full Log to find and diagnose something early in your Preview build.
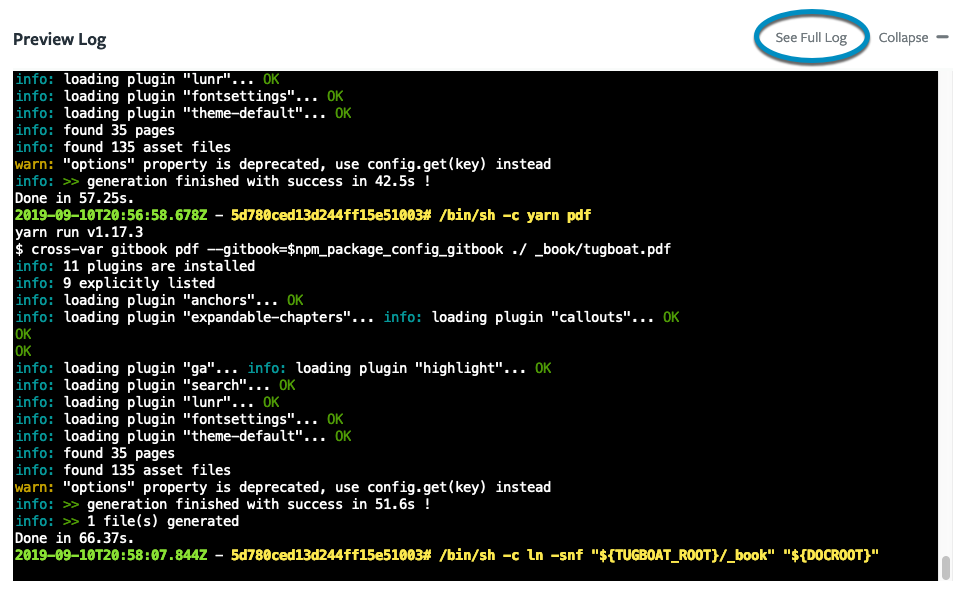
These logs differ from the Service logs in that these logs reflect all the commands in your Preview build, while the Service logs dive deep into the build and output of Services but each log details only that Service. When using the logs for troubleshooting, you may want to start with the Preview log to determine where something went wrong, and then you may dive into that Service’s log to dig deeper.
Captured mail
If you’re using a Tugboat-provided image, outgoing email generated within your Preview should forward to our SMTP proxy. Tugboat captures that outgoing email, and displays it in Captured Mail when you click into a Preview. This makes it possible for you to verify that email is sending as expected.
Tugboat-provided images send outbound email through the Tugboat SMTP proxy by default. If you are using your own image, or your codebase does not use the underlying operating system mail configuration, use the $TUGBOAT_SMTP Environment Variable to ensure that Tugboat is able to properly capture your outbound email.
Warning
Tugboat makes a best-effort attempt at capturing outbound email. Commonly used outbound SMTP ports (25, 465, 587, and 2525) are blocked, and any mail sent through the Tugboat SMTP proxy (on ports 25 and 587) is captured for display with the Preview that sent it.
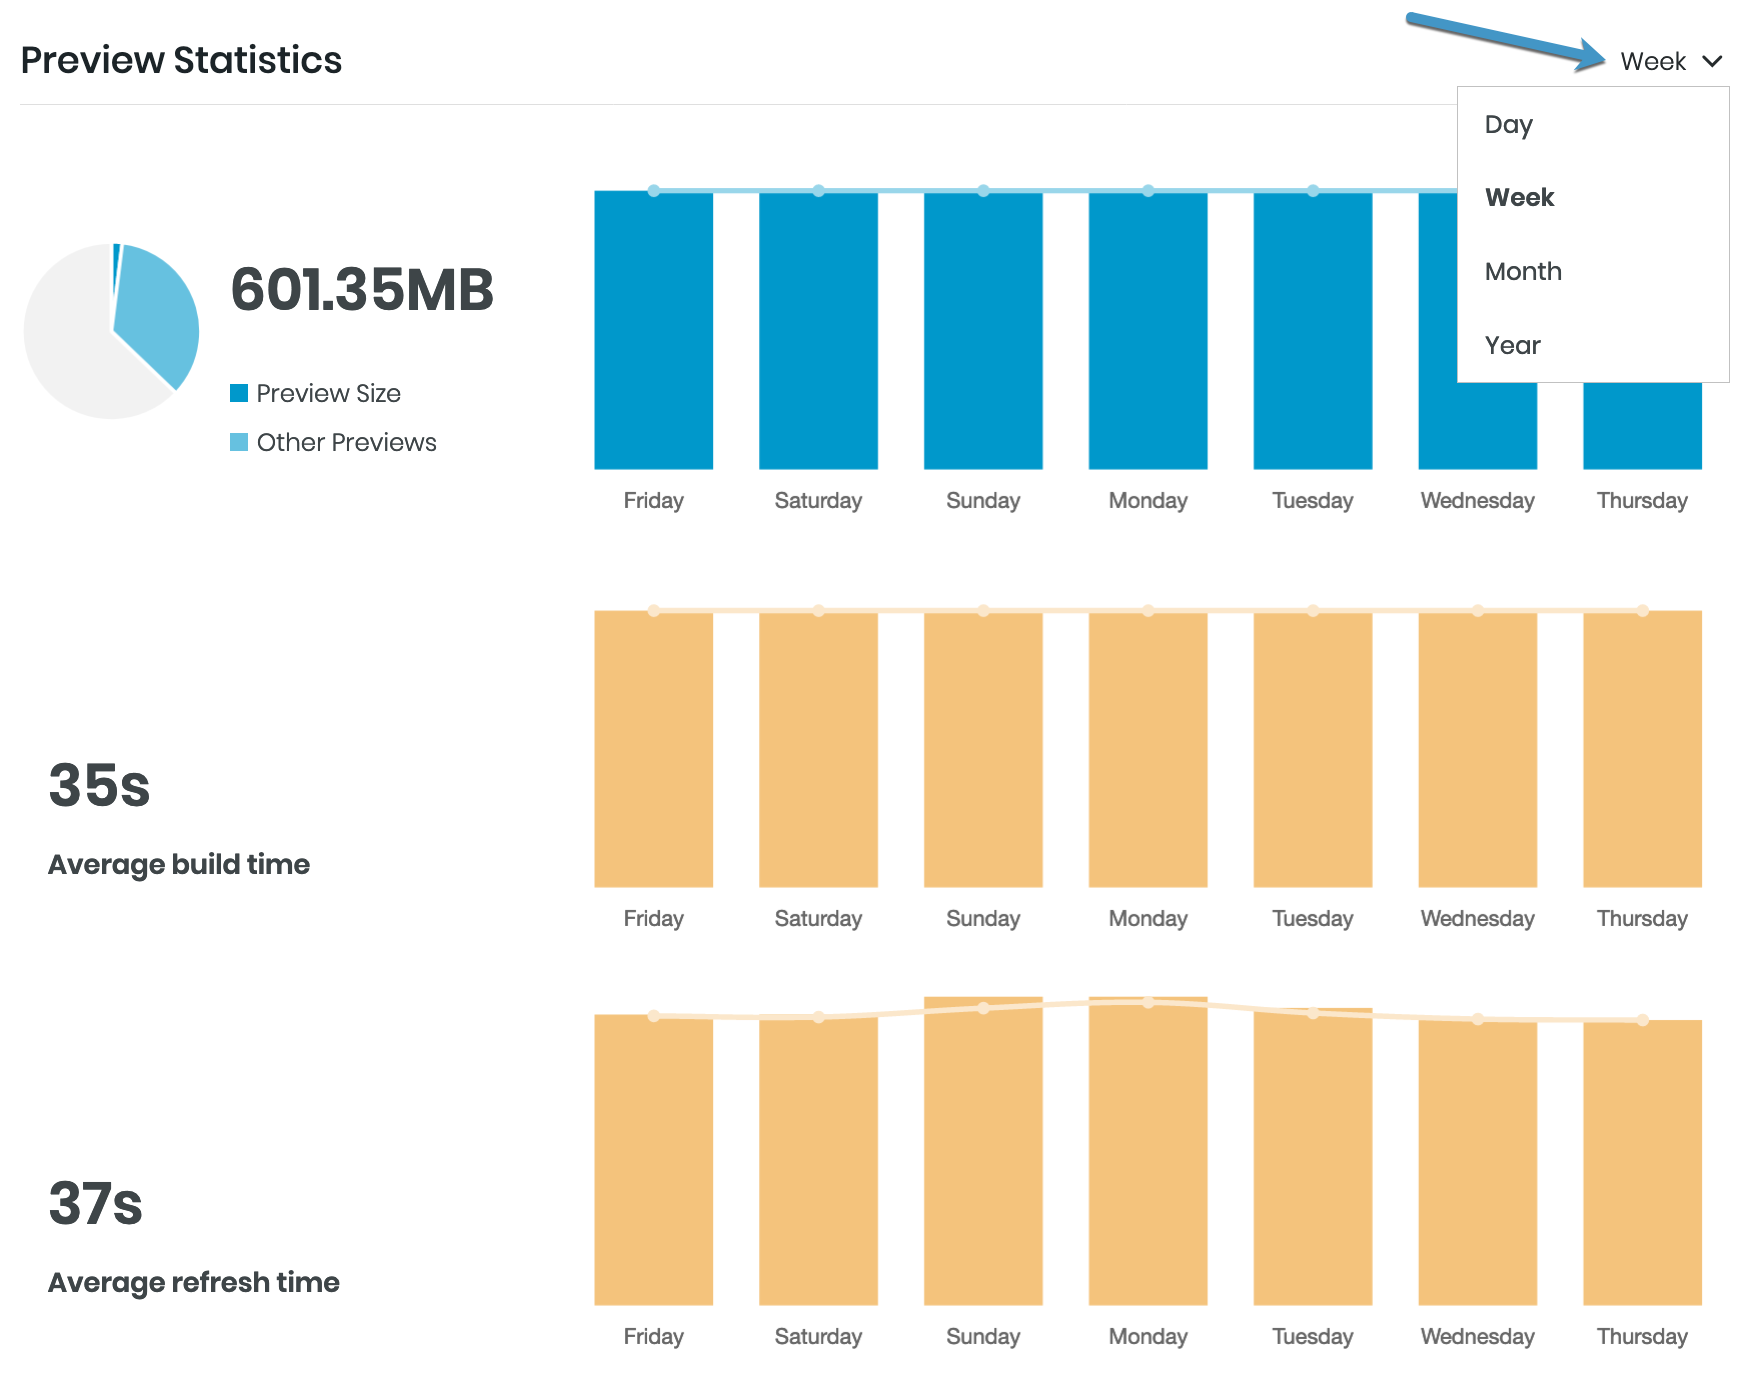
Preview Statistics
As with the Project and Repository views, when you drill down into a Preview, you can view Preview Statistics. These statistics illustrate things like how the size of the Preview has changed over time, as well as how the average build time and average refresh time has changed. These are useful metrics to spot changes that might indicate regressions, or opportunities to optimize your web app or website to reduce asset size or improve build and deploy speeds.
When you click into the drop-down at the upper right-hand corner of the Preview Statistics pane, you can change the view. Options include Day, Week, Month, and Year.